
NoSQL 与搜索 / 系统课时
用 Profile API 定位查询耗时
用 Profile API 定位查询耗时
Profile API 适合回答“慢查询到底慢在哪个 Lucene 查询、Collector 或聚合器上”。本课用一条可复现查询读取分片级执行树,定位 CPU 热点,同时明确它不能替代端到端延迟监控。
学习目标
- 能开启
profile并从分片维度读取 query、collector 与 aggregation 耗时。 - 能识别父子节点的包含关系,避免把 Profile 时间错误相加。
- 能把 Profile 发现映射到查询、聚合和 fetch 的具体优化动作。
先建立可复现的 Profile
下面示例会重建 profile-demo,写入三条文档,再对“checkout 且延迟不低于 100 ms”的查询和状态码聚合开启 Profile。执行前把 <PATH> 与 <API_KEY> 替换为实际 CA 路径和具备该演示索引管理、写入、读取权限的 API Key,并确保已安装 curl 与 jq。
export ES_URL="https://localhost:9200"
export ES_CA="<PATH>"
export ES_API_KEY="<API_KEY>"

curl -sS --cacert "$ES_CA" -H "Authorization: ApiKey $ES_API_KEY" -X DELETE "$ES_URL/profile-demo" >/dev/null
curl -sS --cacert "$ES_CA" -H "Authorization: ApiKey $ES_API_KEY" -H "Content-Type: application/json" -X PUT "$ES_URL/profile-demo" -d '{"settings":{"number_of_shards":1,"number_of_replicas":0},"mappings":{"properties":{"service":{"type":"keyword"},"status":{"type":"integer"},"latency_ms":{"type":"integer"}}}}' >/dev/null
curl -sS --cacert "$ES_CA" -H "Authorization: ApiKey $ES_API_KEY" -H "Content-Type: application/x-ndjson" -X POST "$ES_URL/profile-demo/_bulk?refresh=true&filter_path=errors" --data-binary $'{"index":{}}\n{"service":"checkout","status":200,"latency_ms":120}\n{"index":{}}\n{"service":"checkout","status":500,"latency_ms":180}\n{"index":{}}\n{"service":"payment","status":200,"latency_ms":230}\n'
curl -sS --cacert "$ES_CA" -H "Authorization: ApiKey $ES_API_KEY" -H "Content-Type: application/json" -X POST "$ES_URL/profile-demo/_search?filter_path=hits.total,profile.shards.shard_id,profile.shards.searches.query.time_in_nanos,profile.shards.aggregations.description,profile.shards.aggregations.time_in_nanos" -d '{"profile":true,"size":0,"query":{"bool":{"filter":[{"term":{"service":"checkout"}},{"range":{"latency_ms":{"gte":100}}}]}},"aggs":{"by_status":{"terms":{"field":"status"}}}}' | jq '{hits_total:.hits.total.value,shard:.profile.shards[0].shard_id,query_ns:.profile.shards[0].searches[0].query[0].time_in_nanos,agg_name:.profile.shards[0].aggregations[0].description,agg_ns:.profile.shards[0].aggregations[0].time_in_nanos}'预期输出如下;<NANOS> 是每次运行都会变化的纳秒值。
{"errors":false}
{
  "hits_total": 2,
  "shard": 0,
  "query_ns": <NANOS>,
  "agg_name": "by_status",
  "agg_ns": <NANOS>
}
这里最重要的不是某个绝对纳秒值,而是同一次 Profile 中不同执行组件的相对成本。Profile 本身会增加明显开销,因此不要拿它的耗时直接当作线上 SLA。
从分片向内读 Profile 树
Profile 结果按参与搜索的 shard 返回。每个 shard 内,searches.query 是 Lucene 查询树,collector 描述命中文档如何被收集,aggregations 描述聚合树;需要返回文档时还可能看到 fetch。先找最慢的 shard,再向内找最贵的节点,比从整份响应里逐字段扫数值更有效。
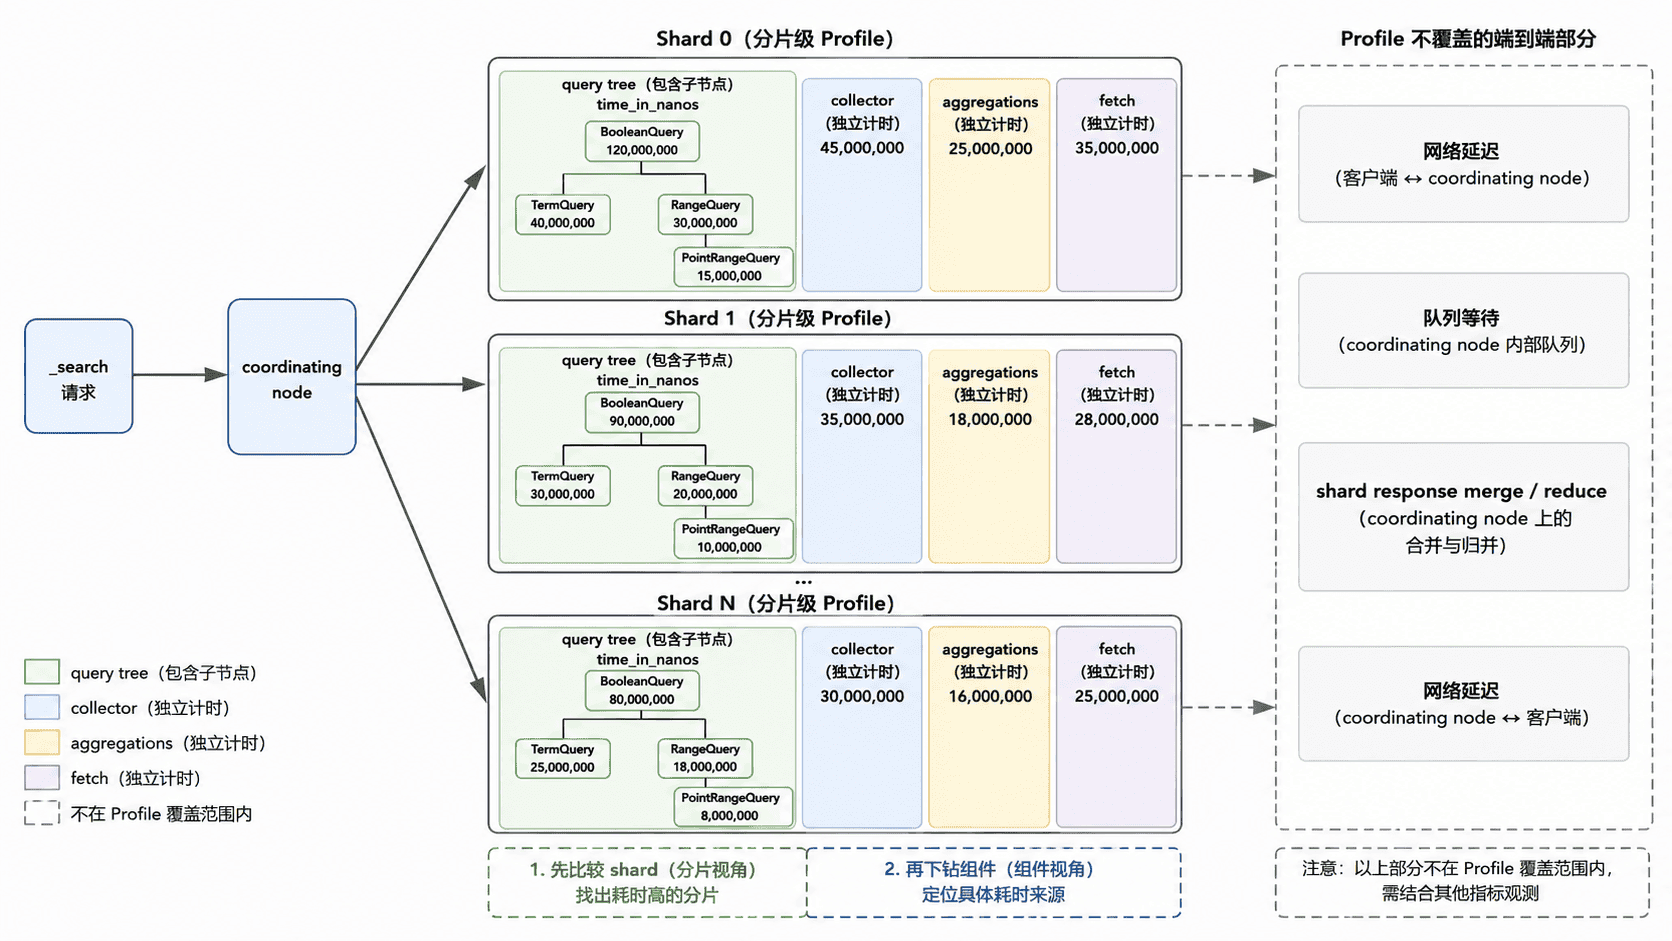
time_in_nanos 是节点执行时间,并且父节点通常包含子节点时间,所以不能把父子节点全部求和。同理,query 与 collector 是不同的计时视角,也不要把两棵树机械相加得到“总查询时间”。
用耗时结构判断热点
先看顶层 query 或 aggregation 的相对占比,再检查 breakdown。如果 build_scorer、next_doc、score 等查询阶段明显突出,应回到查询条件、匹配范围、评分需求和布尔子句数量检查;如果聚合的 collect 或构建结果耗时突出,则重点检查命中文档规模、桶数量和高基数字段。
如果 fetch 明显昂贵,问题通常已经不在匹配阶段,而在返回文档:例如 size 太大、_source 很大或读取了不需要的字段。此时继续微调 query clause 往往收益有限,应先缩小返回集合或做 _source filtering。
把 Profile 结论变成优化
一次有效的优化闭环应保持请求语义不变:先保存原查询和 Profile,修改一个变量,再关闭 profile 用真实负载重复测量。对于过滤条件,优先减少不必要的评分和匹配范围;对于聚合,优先约束输入文档和桶规模;对于 fetch,减少返回条数和字段。
不要追求把某个 Profile 节点“调成零”。真正的验收标准是:相同业务结果下,正常搜索的延迟分位、CPU 使用与吞吐都改善,并且没有把成本转移到别的 shard 或协调节点。