
游戏引擎 / 系统课时
ProfilerRecorder 采样
ProfilerRecorder 采样
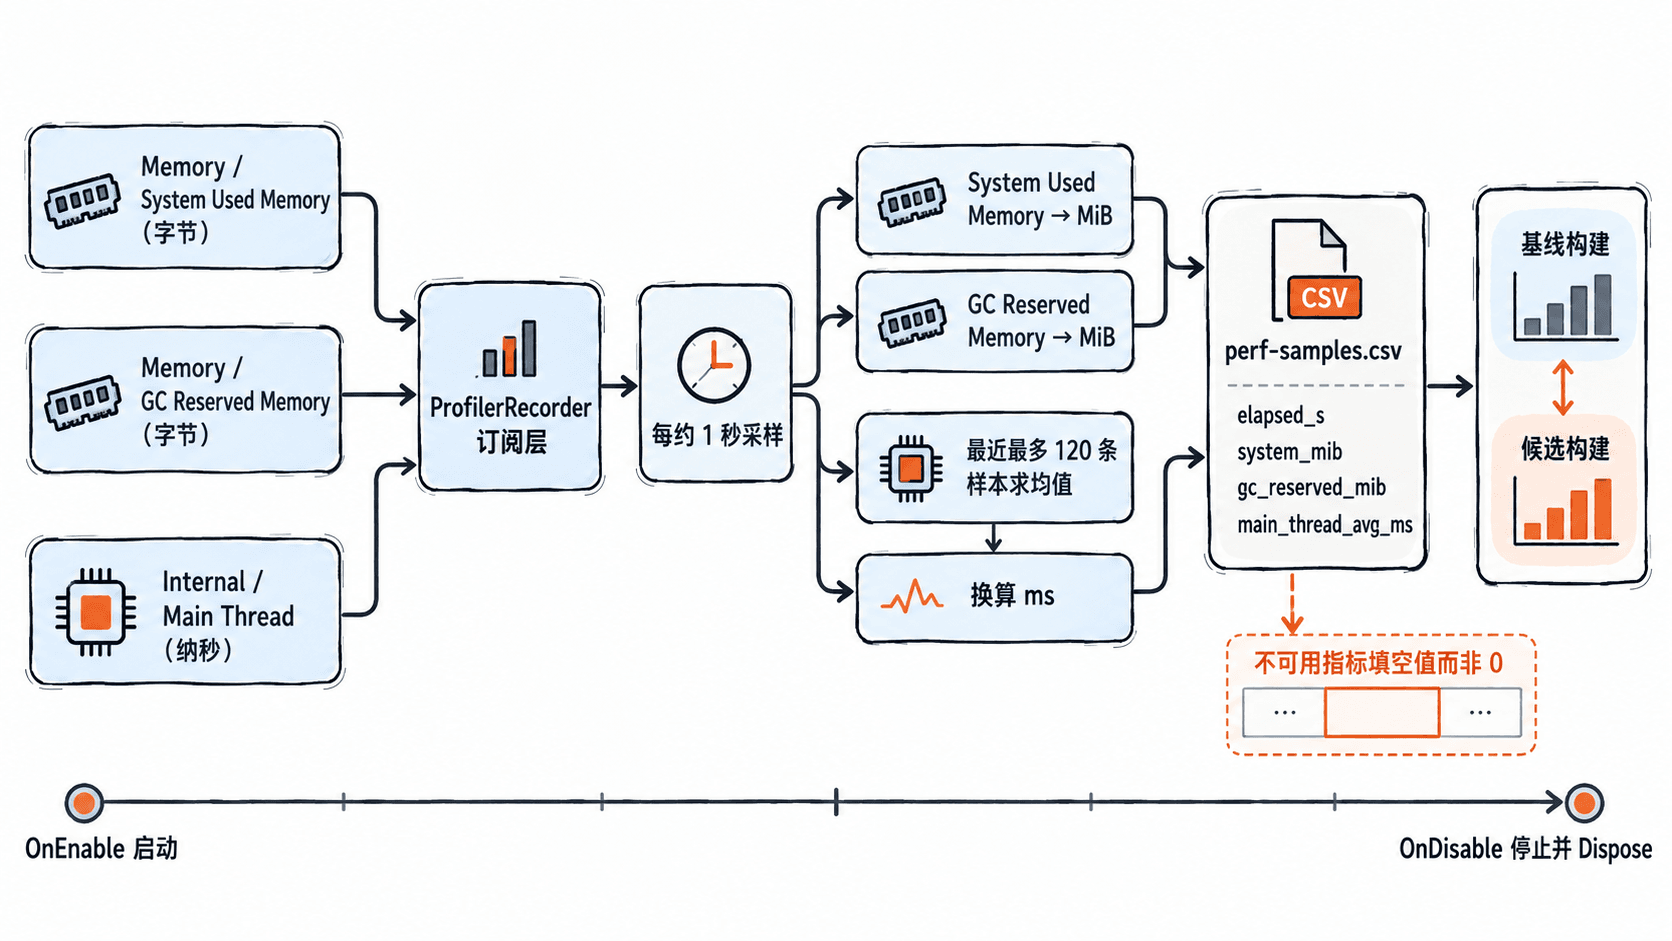
在 Unity 6 的真机运行中,可以用 ProfilerRecorder 定时读取内存和主线程耗时,并写入 CSV,不必手工抄录 Profiler 面板。下面实现每秒一次的采样组件,得到可用于两次构建回归对比的日志。
学习目标
- 选择有明确单位和可用性检查的运行时计数器。
- 在 Unity 6 中启动、采样并正确释放
ProfilerRecorder。 - 导出 CSV,按相同场景和时间窗口比较优化前后的数据。
确定采样指标和单位
ProfilerRecorder.StartNew 通过类别与计数器名称订阅指标。下面选择两项内存计数器和一项主线程计时标记,使用 Unity 6(6000.0)的 Unity.Profiling API;计数器名称可对照 Unity 官方内存计数器说明。
| 指标名称 | 类别 | 原始单位 | CSV 字段及含义 |
|---|---|---|---|
System Used Memory |
ProfilerCategory.Memory |
字节 | system_mib,应用使用内存的估计值 |
GC Reserved Memory |
ProfilerCategory.Memory |
字节 | gc_reserved_mib,托管堆预留内存 |
Main Thread |
ProfilerCategory.Internal |
纳秒 | main_thread_avg_ms,最近最多 120 条主线程样本的平均耗时 |
字节换算为 MiB 时除以 1,048,576,纳秒换算为毫秒时除以 1,000,000。GC Reserved 不是托管对象实际使用量;主线程标记耗时也不等于整帧显示间隔。读取前检查 Valid 和 Count,指标不可用时写空字段,不能把缺失误记成零。
编写定时采样组件
在 Assets/Scripts 下创建 RuntimeProfilerCsv.cs,把以下完整脚本挂到场景中始终激活的空物体。组件启用时开始记录,禁用时停止协程、关闭文件并释放底层记录器。WaitForSecondsRealtime 不受 Time.timeScale 影响,适合场景暂停期间继续取样。
using System.Collections;
using System.Globalization;
using System.IO;
using System.Text;
using Unity.Profiling;
using UnityEngine;

public sealed class RuntimeProfilerCsv : MonoBehaviour
{
    ProfilerRecorder systemUsed;
    ProfilerRecorder gcReserved;
    ProfilerRecorder mainThread;
    StreamWriter csv;
    Coroutine sampling;
    float startTime;
    int unflushedRows;

    void OnEnable()
    {
        systemUsed = ProfilerRecorder.StartNew(
            ProfilerCategory.Memory, "System Used Memory");
        gcReserved = ProfilerRecorder.StartNew(
            ProfilerCategory.Memory, "GC Reserved Memory");
        mainThread = ProfilerRecorder.StartNew(
            ProfilerCategory.Internal, "Main Thread", 120);

        // 每次运行覆盖旧文件,先取回上一轮日志。
        string path = Path.Combine(
            Application.persistentDataPath, "perf-samples.csv");
        csv = new StreamWriter(path, false, new UTF8Encoding(false));
        csv.WriteLine(
            "elapsed_s,system_mib,gc_reserved_mib,main_thread_avg_ms");
        startTime = Time.realtimeSinceStartup;
        sampling = StartCoroutine(Capture());
        Debug.Log("Profiler CSV: " + path);
    }

    IEnumerator Capture()
    {
        var wait = new WaitForSecondsRealtime(1f);
        while (true)
        {
            yield return wait;
            string line = string.Format(
                CultureInfo.InvariantCulture, "{0:F1},{1},{2},{3}",
                Time.realtimeSinceStartup - startTime,
                MemoryMiB(systemUsed),
                MemoryMiB(gcReserved),
                MainThreadAverageMs(mainThread));
            csv.WriteLine(line);
            // 每5条落盘,避免每帧文件I/O。
            if (++unflushedRows >= 5)
            {
                csv.Flush();
                unflushedRows = 0;
            }
        }
    }

    static string MemoryMiB(ProfilerRecorder recorder)
    {
        if (!recorder.Valid || recorder.Count == 0) return "";
        return (recorder.LastValue / 1048576.0)
            .ToString("F1", CultureInfo.InvariantCulture);
    }

    static string MainThreadAverageMs(ProfilerRecorder recorder)
    {
        if (!recorder.Valid || recorder.Count == 0) return "";
        double totalNs = 0;
        int count = recorder.Count;
        for (int i = 0; i < count; i++)
            totalNs += recorder.GetSample(i).Value;
        return (totalNs / count / 1000000.0)
            .ToString("F2", CultureInfo.InvariantCulture);
    }

    void OnDisable()
    {
        if (sampling != null) StopCoroutine(sampling);
        // Dispose 会刷出未落盘行,也会释放文件句柄。
        csv?.Dispose();
        csv = null;
        systemUsed.Dispose();
        gcReserved.Dispose();
        mainThread.Dispose();
    }
}
预期结果:运行后 Console 打印保存路径(<PATH> 因设备而异),禁用组件后该目录内存在 UTF-8 编码的 perf-samples.csv。下面的数字仅演示 CSV 格式,实际值随设备和场景变化;缺失的计数器列会留空。
Profiler CSV: <PATH>/perf-samples.csvelapsed_s,system_mib,gc_reserved_mib,main_thread_avg_ms
1.0,418.7,96.0,8.51
2.0,420.1,96.0,8.76在目标设备验证日志
- 先在 Editor 的 Play 模式运行约 10 秒,停止后通过 Console 打印的路径打开 CSV。文件至少应包含标题行及若干采样行;
elapsed_s应大致以一秒递增,不要求严格等于整数秒。 - 在 Unity 6 的 File > Build Profiles 中选定目标平台,勾选 Development Build 后构建并部署真机,以便检查计时标记。内存高层计数器也可用于 Release Player,但可用指标仍须在目标构建上核实。
- 在同一分辨率、画质、帧率设置下运行固定场景 90 秒,前 15 秒作为预热。退出或禁用组件使文件正常关闭,再从
Application.persistentDataPath对应的设备目录取回文件,另存为baseline.csv。 - 使用候选构建重复操作并保存为
candidate.csv。因示例每次启用组件都会覆盖同名文件,务必在下一轮运行前先备份。
按固定窗口判断是否回归
比较时只截取 elapsed_s 在 15~75 秒的记录,确保两轮采样使用相同玩法路径与设备温度条件。对 main_thread_avg_ms 求窗口均值,对 system_mib 同时检查均值和峰值;空值视为缺测,不参与统计。
例如,基线主线程窗口均值为 7.5 ms,候选版本为 9.0 ms,增长 20%;基线内存峰值 480 MiB,候选为 528 MiB,多出 48 MiB。若团队约定主线程增幅超过 10% 或内存峰值增加超过 30 MiB 即告警,本次两项都应判为待排查。阈值只是项目示例,不是 Unity 的通用标准。
这里每一行的主线程数值是最近最多 120 次样本的滑动均值,不能用其推导原始单帧的 P95 或最差长帧。需要定位某个卡顿尖峰时,应回到 CPU Profiler Timeline 做逐帧核实;CSV 更适合持续回归监测。