
容器与云原生 / 系统课时
使用流量镜像验证新版本
使用流量镜像验证新版本
流量镜像不会把用户切到 v2,而是在 v1 继续返回主响应时复制少量真实请求给候选版本。本文完成配置、发流量,并用 v2 访问日志和 istio_requests_total 增量证明镜像确实发生,同时说明副作用隔离与退出条件。
学习目标
- 配置
VirtualService的 v1 主路由与 v2 按比例镜像 - 用访问日志和
istio_requests_total证明影子请求确实到达 v2 - 结合关联标识与副作用隔离判断候选版本能否继续灰度
先把主响应和影子请求分开
一次请求进入 Istio 数据面后,正常路由仍决定真正返回给调用方的目标;镜像会额外复制一份 HTTP 请求到候选目标。镜像请求采用 fire-and-forget 方式,v2 的响应会被丢弃,因此 v2 返回 5xx 或响应较慢不会直接改写这次用户响应。
镜像比例也不会从主路由“扣流量”。主路由保持 v1 的 100% 时,mirrorPercentage: 10.0 表示再抽样复制约 10% 请求到 v2,而不是把主流量拆成 90%/10%。镜像请求的 Host/Authority 会附加 -shadow 后缀,短时间样本也不保证恰好每 10 个请求镜像 1 个。
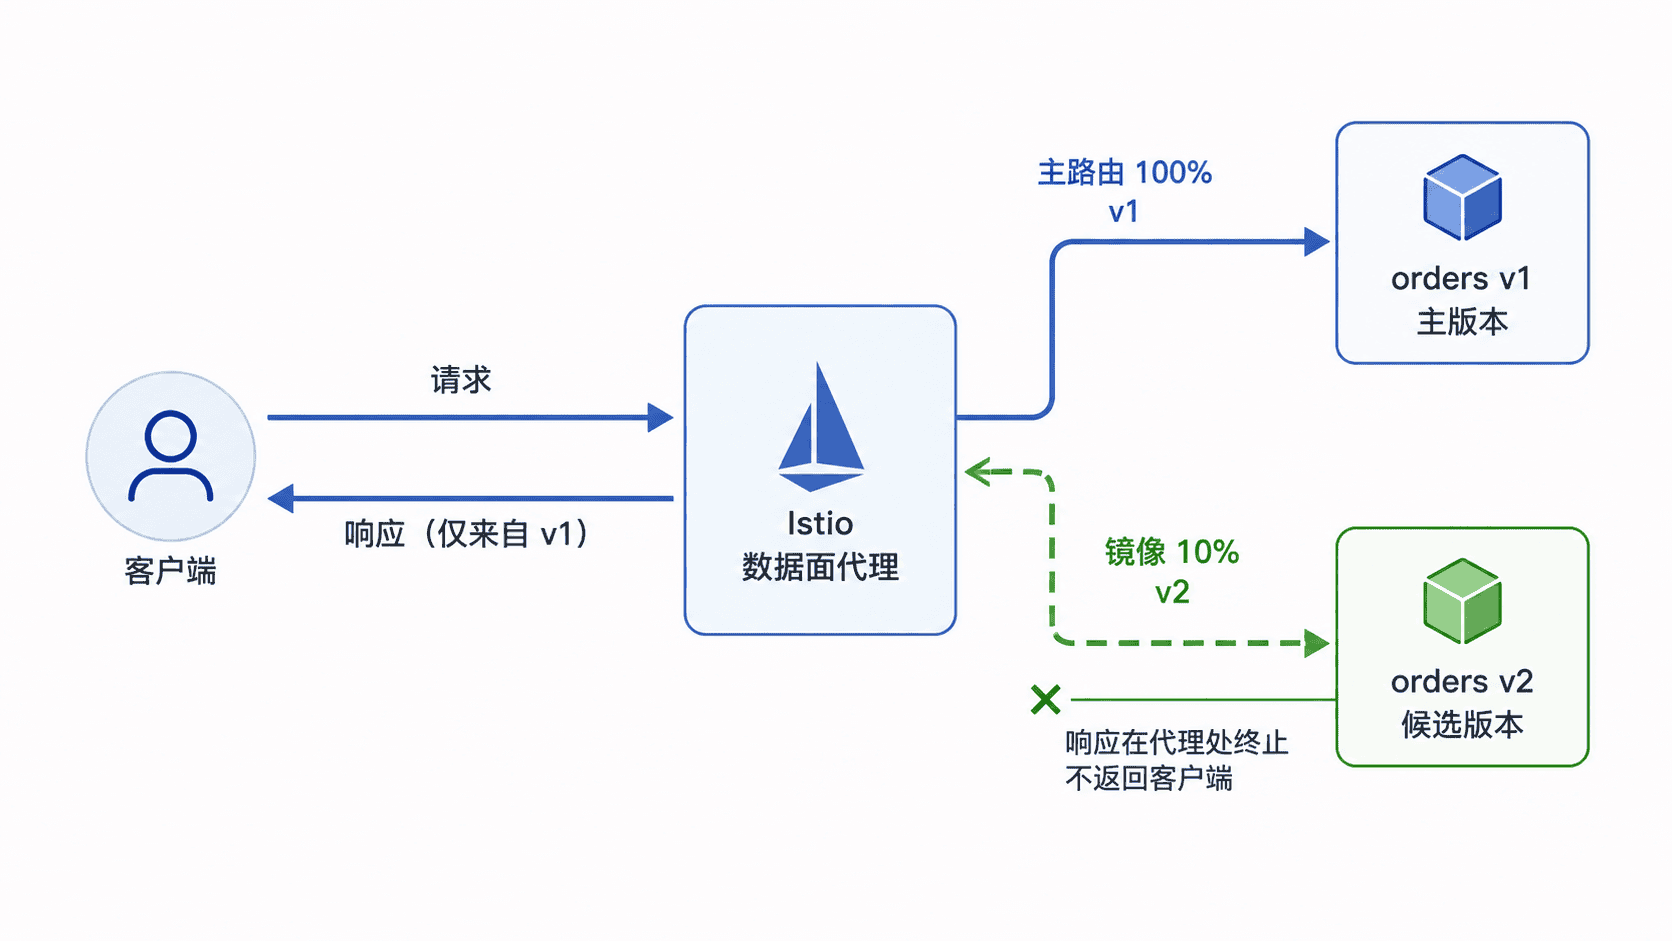
配置 v1 主流量和 v2 镜像
下面假设 orders Service 的后端 Pod 使用共同标签 app: orders,并分别带有 version: v1、version: v2。示例同时为这两个版本启用 Envoy 访问日志;如果集群已有会选中同一工作负载的 Telemetry,应复用或调整现有策略,避免创建重叠的工作负载级配置。
set -eu
NS=default

kubectl apply -n "$NS" -f - <<'EOF' >/dev/null
apiVersion: networking.istio.io/v1
kind: DestinationRule
metadata:
  name: orders
spec:
  host: orders
  subsets:
  - name: v1
    labels:
      version: v1
  - name: v2
    labels:
      version: v2
---
apiVersion: networking.istio.io/v1
kind: VirtualService
metadata:
  name: orders
spec:
  hosts:
  - orders
  http:
  - route:
    - destination:
        host: orders
        subset: v1
      weight: 100
    mirror:
      host: orders
      subset: v2
    mirrorPercentage:
      value: 10.0
---
apiVersion: telemetry.istio.io/v1
kind: Telemetry
metadata:
  name: orders-access-log
spec:
  selector:
    matchLabels:
      app: orders
  accessLogging:
  - providers:
    - name: envoy
EOF

kubectl get virtualservice orders -n "$NS" \
  -o jsonpath='{.spec.http[0].route[0].destination.subset}{" "}{.spec.http[0].route[0].weight}{" -> mirror "}{.spec.http[0].mirror.subset}{" "}{.spec.http[0].mirrorPercentage.value}{"\n"}'
预期输出
v1 100 -> mirror v2 10这个结果只证明期望配置已写入 Kubernetes/Istio 控制面,不能证明 v2 已收到影子请求。真正的验证必须继续产生流量,并从数据面的日志或指标取证。
发请求并验证日志和指标
下面创建一个注入 Sidecar 的临时客户端,先记录全部 v2 Pod 的请求计数,再发送 100 个只读请求,最后同时检查 v1/v2 访问日志和 v2 sidecar 的 istio_requests_total 增量。脚本用唯一的 mirror_probe 关联同一个请求;生产流量应改用已有的 x-request-id、trace ID 或业务关联标识。
set -eu
NS=default
REQ_PATH="${REQ_PATH:-/}"

kubectl wait -n "$NS" --for=condition=Ready pod -l app=orders,version=v2 --timeout=90s >/dev/null
V2_PODS=$(kubectl get pod -n "$NS" -l app=orders,version=v2 -o name)
test -n "$V2_PODS"

metric_total() {
  total=0
  for pod in $V2_PODS; do
    value=$(kubectl exec -n "$NS" "${pod#pod/}" -c istio-proxy -- \
      curl -fsS http://127.0.0.1:15000/stats/prometheus |
      awk '
        /^istio_requests_total\{/ &&
        /reporter="destination"/ &&
        /destination_service_name="orders"/ &&
        /destination_version="v2"/ {sum += $NF}
        END {printf "%.0f\n", sum + 0}
      ')
    total=$(awk -v a="$total" -v b="$value" 'BEGIN {printf "%.0f", a + b}')
  done
  printf '%s\n' "$total"
}

kubectl delete pod mirror-client -n "$NS" --ignore-not-found >/dev/null
kubectl run mirror-client -n "$NS" \
  --image=curlimages/curl:8.12.1 \
  --restart=Never \
  --annotations='sidecar.istio.io/inject=true' \
  --command -- sleep 3600 >/dev/null
kubectl wait -n "$NS" --for=condition=Ready pod/mirror-client --timeout=90s >/dev/null
kubectl get pod mirror-client -n "$NS" \
  -o jsonpath='{.spec.containers[*].name}' | grep -qw istio-proxy

BEFORE=$(metric_total)
RUN_ID=$(date +%s)

for i in $(seq -w 1 100); do
  kubectl exec -n "$NS" mirror-client -c mirror-client -- \
    curl -fsS --connect-timeout 2 --max-time 5 -o /dev/null \
    "http://orders${REQ_PATH}?mirror_probe=${RUN_ID}-${i}"
done

sleep 3
AFTER=$(metric_total)
METRIC_DELTA=$(awk -v after="$AFTER" -v before="$BEFORE" \
  'BEGIN {printf "%.0f", after - before}')

V1_LOG=$(mktemp)
V2_LOG=$(mktemp)
trap 'rm -f "$V1_LOG" "$V2_LOG"' EXIT

kubectl logs -n "$NS" -l app=orders,version=v1 -c istio-proxy \
  --since=5m --tail=-1 --max-log-requests=20 >"$V1_LOG"
kubectl logs -n "$NS" -l app=orders,version=v2 -c istio-proxy \
  --since=5m --tail=-1 --max-log-requests=20 >"$V2_LOG"

V1_COUNT=$(grep -c "mirror_probe=${RUN_ID}-" "$V1_LOG" || true)
V2_COUNT=$(grep "mirror_probe=${RUN_ID}-" "$V2_LOG" | grep -c -- '-shadow' || true)
PROBE=$(grep "mirror_probe=${RUN_ID}-" "$V2_LOG" | grep -- '-shadow' |
  grep -o "mirror_probe=${RUN_ID}-[0-9]*" | head -n 1 | cut -d= -f2)

printf 'generated=100 v1_log_count=%s v2_shadow_log_count=%s v2_metric_delta=%s\n' \
  "$V1_COUNT" "$V2_COUNT" "$METRIC_DELTA"

test "$V1_COUNT" -eq 100
test "$V2_COUNT" -gt 0
test "$METRIC_DELTA" -gt 0
test -n "$PROBE"
grep -q "mirror_probe=${PROBE}" "$V1_LOG"
grep "mirror_probe=${PROBE}" "$V2_LOG" | grep -q -- '-shadow'

printf 'selected=%s\nv1_match=yes\nv2_shadow_match=yes\n' "$PROBE"
预期输出
generated=100 v1_log_count=100 v2_shadow_log_count=<VALUE> v2_metric_delta=<VALUE>
selected=<ID>
v1_match=yes
v2_shadow_match=yes
v2_shadow_log_count 与 v2_metric_delta 通常接近 10,但会因随机抽样和并发背景流量而波动;<ID>、<VALUE> 以实际结果为准。日志中的 -shadow 证明请求属于镜像副本,指标增量证明 v2 的数据面实际处理了请求,二者都比只读回 mirrorPercentage 更接近运行事实。
把副作用隔离纳入门禁
候选版本响应被丢弃,并不代表候选请求不会执行写操作。创建订单、扣库存、发消息、调用支付等副作用仍会在 v2 真正发生,因此镜像环境必须先具备隔离策略:只镜像只读接口,或让 v2 写入隔离库、禁用外部写操作,并把支付、消息等下游切到专用测试目标。
日志适合用请求标识核对“同一输入是否同时到达 v1 与 v2”;istio_requests_total、错误码和请求时延适合看整体趋势;trace 则适合定位候选版本内部或下游调用差异。对于时间、随机数等天然不确定字段,应先定义允许差异范围,再做结果比较。
设定退出条件
镜像应有明确的通过与停止条件。可以先用 1%~10% 覆盖一个完整业务周期,观察 v2 的错误率、尾延迟、关键业务校验和资源消耗;满足门禁后再进入真正由 v2 返回响应的金丝雀阶段,持续异常时则删除镜像配置而保持 v1 主路由不变。
还要评估镜像带来的额外 CPU、连接数和下游调用量。流量镜像适合验证兼容性和真实负载下的候选行为,但它不会让用户收到 v2 响应,因此不能替代真正的灰度承载。