
游戏客户端架构 / 系统课时
统计模块耗时
统计模块耗时
本课将为更新、碰撞检测、资源加载和渲染建立统一计时方式,并把结果汇总到一帧的性能报告中。完成后,你能快速判断时间花在哪个模块,而不是只看到“帧率下降”。
学习目标
- 使用高精度时钟测量模块执行时间
- 用作用域计时器减少重复代码
- 正确解读同步与异步任务的计时结果
先明确测量边界
模块耗时应从“进入模块”开始,到“该模块在当前线程上的工作结束”为止。更新和碰撞检测通常可以直接测量;渲染计时默认只统计 CPU 提交命令的时间,不等于 GPU 真正完成绘制的时间;异步资源加载则应分别记录任务提交时间和后台完成时间。
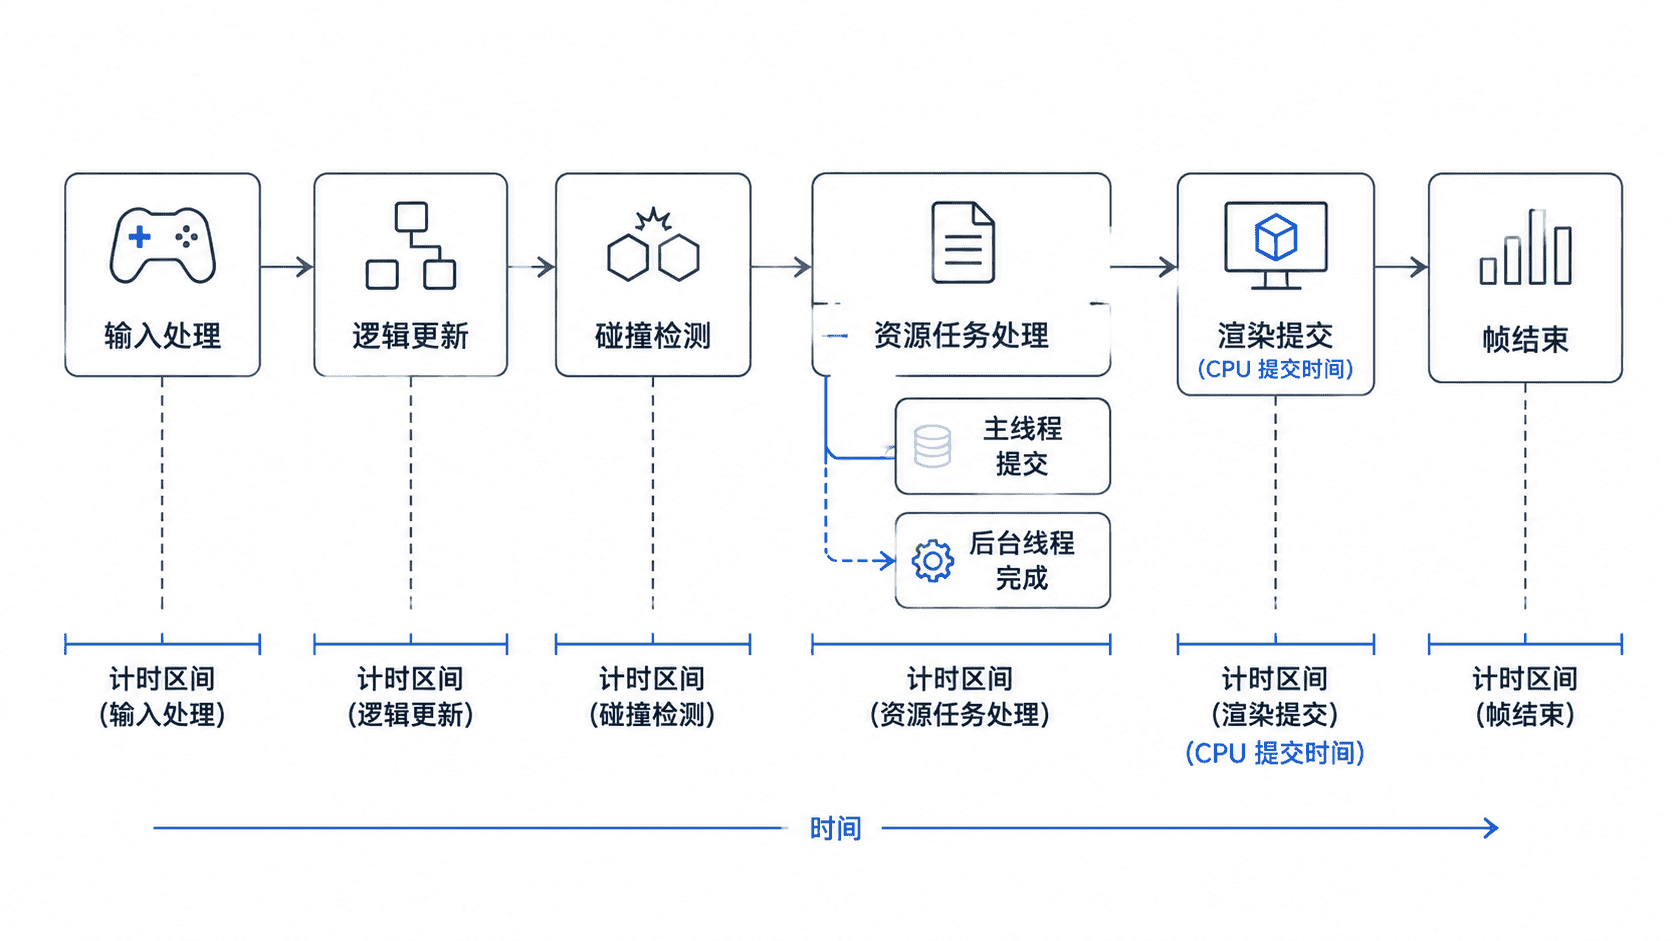
统一边界后,数据才具有可比性。不要在某个模块中包含日志、休眠或等待调试器等额外操作,否则测到的是调试开销,而不是模块本身的成本。
实现作用域计时器
下面的 C++17 示例使用 std::chrono::steady_clock。计时器在构造时记录起点,在离开作用域时自动累加微秒数,因此即使函数提前返回,也不会漏记。
#include <chrono>
#include <cstdint>
#include <iostream>
#include <map>
#include <string>
#include <utility>

class FrameProfiler {
public:
    void add(const std::string& name, std::int64_t microseconds) {
        totals_[name] += microseconds;
    }

    void print() const {
        for (const auto& [name, value] : totals_) {
            std::cout << name << ": " << value << " us" << std::endl;
        }
    }

private:
    std::map<std::string, std::int64_t> totals_;
};

class ScopedTimer {
public:
    ScopedTimer(FrameProfiler& profiler, std::string name)
        : profiler_(profiler),
          name_(std::move(name)),
          start_(Clock::now()) {}

    ~ScopedTimer() {
        const auto end = Clock::now();
        const auto elapsed =
            std::chrono::duration_cast<std::chrono::microseconds>(end - start_).count();
        profiler_.add(name_, elapsed);
    }

private:
    using Clock = std::chrono::steady_clock;

    FrameProfiler& profiler_;
    std::string name_;
    Clock::time_point start_;
};

void update() {
    volatile std::int64_t value = 0;
    for (int i = 0; i < 200000; ++i) {
        value += i;
    }
}

void detectCollisions() {
    volatile std::int64_t value = 0;
    for (int i = 0; i < 120000; ++i) {
        value += i * 2;
    }
}

void processResources() {
    volatile std::int64_t value = 0;
    for (int i = 0; i < 80000; ++i) {
        value += i * 3;
    }
}

void render() {
    volatile std::int64_t value = 0;
    for (int i = 0; i < 150000; ++i) {
        value += i * 4;
    }
}

int main() {
    FrameProfiler profiler;

    {
        ScopedTimer timer(profiler, "Update");
        update();
    }
    {
        ScopedTimer timer(profiler, "Collision");
        detectCollisions();
    }
    {
        ScopedTimer timer(profiler, "Resource");
        processResources();
    }
    {
        ScopedTimer timer(profiler, "RenderCPU");
        render();
    }

    profiler.print();
    return 0;
}
预期输出如下,具体数值会因 CPU、编译优化和系统负载不同而变化。
Collision: <TIME_US> us
RenderCPU: <TIME_US> us
Resource: <TIME_US> us
Update: <TIME_US> us
接入真实游戏循环
在真实引擎中,应每帧清空当前统计,分别包住各模块,再把结果写入最近若干帧的环形缓冲区。界面显示时优先使用最近 60~120 帧的平均值和最大值,而不是只看单帧瞬时数据。
平均值反映持续成本,最大值用于发现偶发卡顿。例如资源模块平均只有 0.2 毫秒,但最大值达到 18 毫秒,通常说明某一帧发生了同步文件读取、纹理解码或资源释放。
Tips:发布性能测试版本时应开启编译优化,同时关闭高频调试日志。Debug 构建的函数调用、边界检查和日志成本可能掩盖真实瓶颈。
避免常见误判
计时结果只能说明“某段代码经过了多久”,不能直接说明原因。碰撞检测耗时升高,可能是对象数量增加、空间索引失效,也可能是调试绘制占用了同一模块。应继续结合对象数量、查询次数等业务计数器分析。
多线程模块也不能只测主线程等待时间。若资源加载在后台执行,主线程的提交耗时很低并不代表任务便宜;应在工作线程内部记录解码、上传准备和完成时间,并通过任务 ID 关联一次完整加载。
本课总结
- 使用单调高精度时钟和作用域计时器,可以稳定统计各模块的 CPU 执行时间
- 平均值用于观察持续负载,最大值用于定位偶发尖峰
- 异步资源和 GPU 渲染必须明确计时边界,不能把主线程耗时当作完整成本
下一课预告
下一课将把耗时数据与绘制次数、顶点数量和纹理切换结合起来,进一步判断渲染瓶颈来自命令提交、几何规模还是状态切换。